Investigations
This page will highlight some of the activities/investigations we do in our Math/Physics class.
Conversion Olympics
This investigation was all about taking units and converting them to other units. There were different events that each group participated in and with our performance in each event we received a score/number that we would have to convert into another unit. For example, one event involved throwing a paper discuss. We threw the discuss and measured how far we threw it in inches, which we would later have to convert to centimeters. After everyone finished this event, the scores would be put together and whichever group had the longest throw won a prize. It was a very fun day and a great way to learn.
Barbie Bungie Lab
In this lab, our goal, as a group of three students, was to estimate how long of a rubber band rope we would need to make to have our barbie doll jump off a ledge and get as close to the ground as possible without hitting it. To decide this, we started a trial of many small jumps. We recorded the amount of rubber bands used in each rope and the height of the fall. We found the average of that information to help with our estimation of our original goal. I learned a lot on how to find out a number that I do not know by using smaller versions and collecting data of the problem I am facing.`
K3: Moving Man Lab
This lab was about motion in one direction. We used an online simulator that consisted of a moving man going back and forth over a number line. The simulator shows students the position, velocity, and acceleration versus time of the moving man. It taught me how to better understand PvT, VvT, and AvT graphs.
This is the online simulator: http://phet.colorado.edu/en/simulation/moving-man
This is the online simulator: http://phet.colorado.edu/en/simulation/moving-man
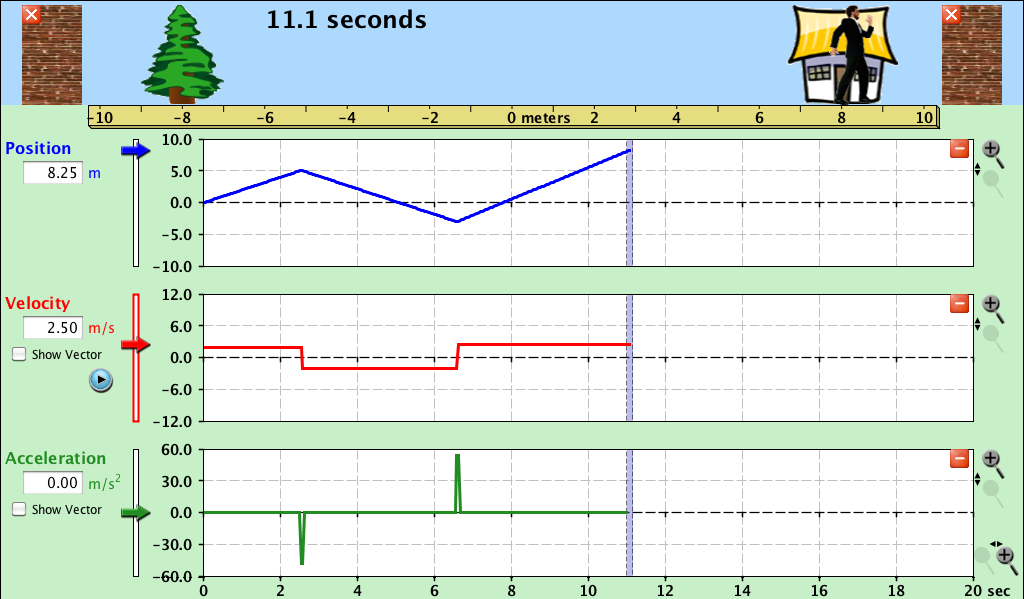
Position Versus Time Graph: The above graph shows how the moving man moved from 0 to 8.25 meters. It clearly shows that he was progressing forward to 5 meters, immediately turned around and moved to -3 meters, then, at a faster speed, stopped at 8.25 meters.
Velocity Versus Time Graph: The above graph shows the moving man's velocity over time. It shows how he had a constant velocity of 2 m/s, then switched to a negative constant velocity of -2 m/s, then, lastly, switched to a positive constant velocity of 2.5 m/s.
Velocity Versus Time Graph: The above graph shows the moving man's velocity over time. It shows how he had a constant velocity of 2 m/s, then switched to a negative constant velocity of -2 m/s, then, lastly, switched to a positive constant velocity of 2.5 m/s.
Motion In One Dimension
This semester, we investigated motion in one dime. We learned about speed, velocity, acceleration, displacement, position vs. time graphs, velocity vs. time graphs, and many other things. We discussed three key ideas and they are listed below.
Key Idea #1: The slope of a position time graph tells us about an objects velocity.
Key Idea #2: The slope of a velocity time graph tells us about an objects acceleration.
Key Idea #3: The area under a velocity time graph (bound by axis and line) is equal to the displacement of the object.
I learned a lot during this period of time while we investigated this. I really understand it and am proud of the work i have done.
